

Kids Jumping Off Our Roof! – Bad Parenting & Stock Market Downturns
We had a crazy December in the stock markets, prices dropped for most of the month, and Christmas Eve was particularly unpleasant – the worst market day before Christmas since 1933 according to Dow Jones Market Data. In fact, the whole month of December had poor performance, a notable exception to history as December is normally one of the best months of the year.
And then, January was fabulous, with major US stock indexes having their best January since 1987. What happened, and what should we be watching for in 2019?
They are Jumping off the Roof! – The Tax Loss Trampoline Effect
I came home one warm spring day several years ago and heard waves of nervous giggling coming from high above my head. My four kids were always a little wild and unruly, and notorious for pushing their physical boundaries and various crazy hijinks. My wife and I stopped counting after 24 trips to the emergency room for various broken bones, concussions, and stitches. It is slightly miraculous that we never got a visit from Child Protective Services due to our frequent flyer trips to the ER.
I peered overhead to spot my four little ruffians accompanied by two of their friends standing near the peak of our roof, right above our trampoline. Being a great parent with powerful paternal protective instincts, I of course immediately pulled out my phone to document their wild leaps. Their jumps were spectacular, when each of them hit the tramp they flew far up into the air, feet and hands flailing wildly. The kinetic energy from jumping from so high compressed the tramp way down, and then rebounded to hurl them far up into the sky – the exact thrill they were hoping for.
I am happy to report that none of them got injured that day and our trampoline continued to be used for years with great joy and exuberance. But what does this bit of Gevers family lore have to do with your investments and the December stock market drop and January bounce?

The markets seemed to have had a trampoline effect in December and January, perhaps due to tax loss harvesting. Remember that 2016 & 2017 were positive years for US stocks and so investors had little opportunity to take losses in those years. As the stock market drooped into late 2018, it become apparent that the normal December rally was not going to occur, and investors started selling positions to recognize tax losses before year-end. The more tax loss selling, the more stocks dropped, and so it may have created a self-fulfilling cycle. Here in our offices, we did not have a relaxing Christmas holiday as we spent hours implementing tax loss strategies for our clients with non-IRA portfolios. (Thanks, Garrett, for coming in really early on Dec. 26th to help finish the project!) Just like my kids’ jump from the roof compressed the trampoline – unusual amounts of tax loss selling compressed the stock market.
The IRS rules for tax loss harvesting allow an investor to buy back their positions after 31 days, and because of this it is common for a bounce to occur in January after tax loss selling in December. Again, just as my kids were hurled up in the air by the trampoline – the stock markets bounced back in January.
So, the markets ups and downs over the last couple of months may have been a little unnerving, but recognizing the phenomena of tax loss selling and remembering my four kids daring trampoline leaps might explain the markets drop and subsequent bounce back.
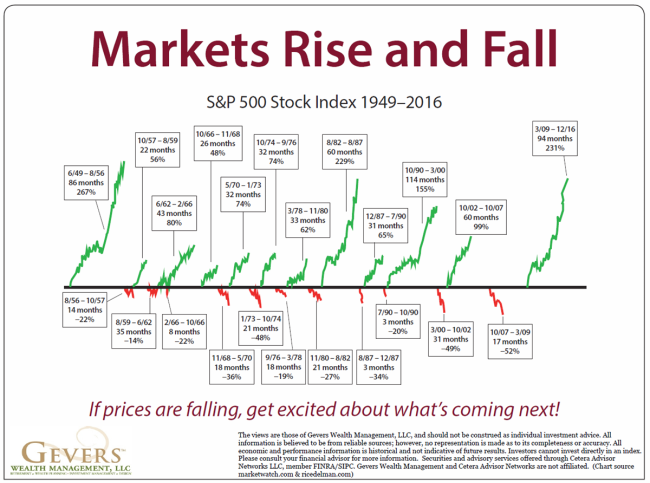
Is this a Bear Market?
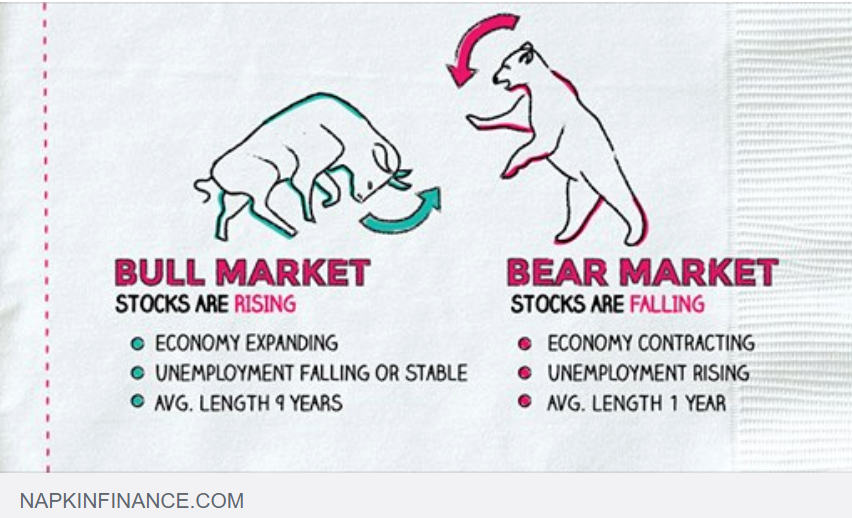
The Dow Jones dropped almost exactly 20% from the peak in September, and one of the definitions of a “bear market” is a 20% drop in stock prices so technically speaking, yes. However, the US economy is not in a recession, in fact the economic health of our country was spectacular in 2018. It is important to remember that a recession should not be something to be feared by investors, if they have their financial house in good shape. Recessions have happened often, and we can be sure they will continue to occur frequently during our investment lifetime. Average length of a recession in the US? About a year or so – if you can weather a stretch that long without withdrawing or liquidating your investments you might be just fine based on market history.
If the stock markets did so poorly in 2018, was it because of the economy? Investors should remember that strong economic numbers do not automatically mean that the stock market will rise, however prolonged favorable economic indicators are often and usually linked with robust stock market conditions. Let’s review the economic numbers for last year and see what the projections are for 2019 and beyond.
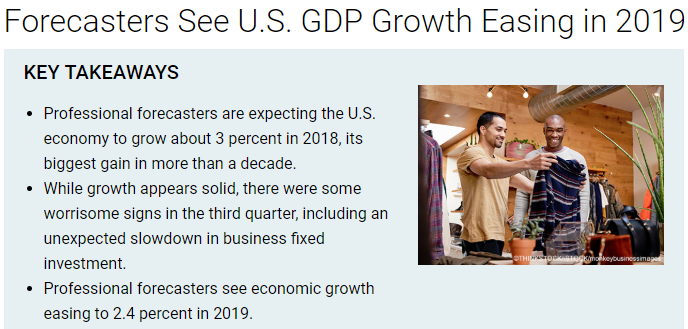
Gross Domestic Product
I recently wrote about 2018’s wonderful GDP growth rates ( You can read about it Here ) GDP growth is forecasted to still be good, but not quite as high as last year’s number. A couple of things to consider – the baseline assumption for GDP forecasts for the IMF and many other economists, is that the US will not be able to reach an agreement with China and that both countries will enact onerous tariff burdens on each other’s trade goods. If we do sign a trade agreement, it is possible that GDP could be even better. And, even if a lower GDP of mid 2% is the reality – that is still far higher than the average of the previous 8 years before 2018.
https://www.thebalance.com/us-economic-outlook-3305669
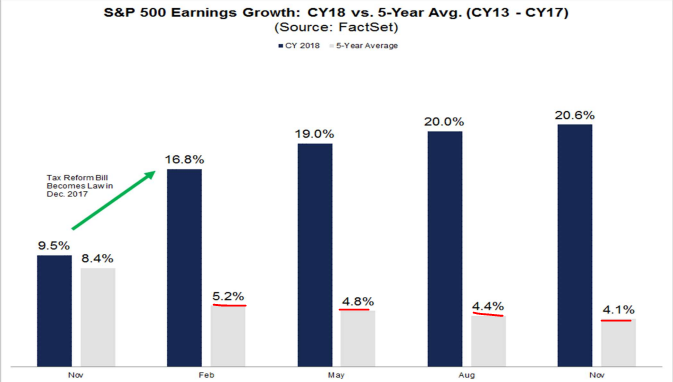
Corporate Profits
Corporate profitability might be the single most important economic number to watch from an investor’s viewpoint. Just like GDP, last year’s numbers were spectacular, and 2019 is projected to be good, but lower than 2018. Investors will be watching corporate earnings reports with keen interest.
2018 US Stock Market Earnings Growth was MUCH HIGHER than normal
https://www.factset.com/hubfs/Resources%20Section/Research%20Desk/Earnings%20Insight/EarningsInsight_122118.pdf
Valuation
When stock prices go down and earnings go up, then stocks become more attractively valued – exactly what occurred in 2018. Does that mean that stock prices can’t go lower? – No. However, it does signal that this might be a more attractive time to be a buyer of, and a holder of stocks
Here is a summary from the recent FactSet report on earnings. (I’ll translate the jargon for you – it says that stocks have become undervalued…)
Valuation: Forward P/E Ratio is 14.2, Below the 10-Year Average (14.6) The forward 12-month P/E ratio is 14.2. This P/E ratio is below the 5-year average of 16.4 and below the 10-year average of 14.6. It is also below the forward 12-month P/E ratio of 16.8 recorded at the start of the fourth quarter (September 30). Since the start of the fourth quarter, the price of the index has decreased by 15.3%, while the forward 12-month EPS estimate has increased by 0.3%. In fact, the last time the forward 12-month P/E ratio for the S&P 500 was 14.2 or lower was October 16, 2014 (also 14.2). At the sector level, the Consumer Discretionary (17.8) sector has the highest forward 12-month P/E ratio, while the Financials (10.2) sector has the lowest forward 12-month P/E ratio.
https://www.factset.com/hubfs/Resources%20Section/Research%20Desk/Earnings%20Insight/EarningsInsight_122118.pdf
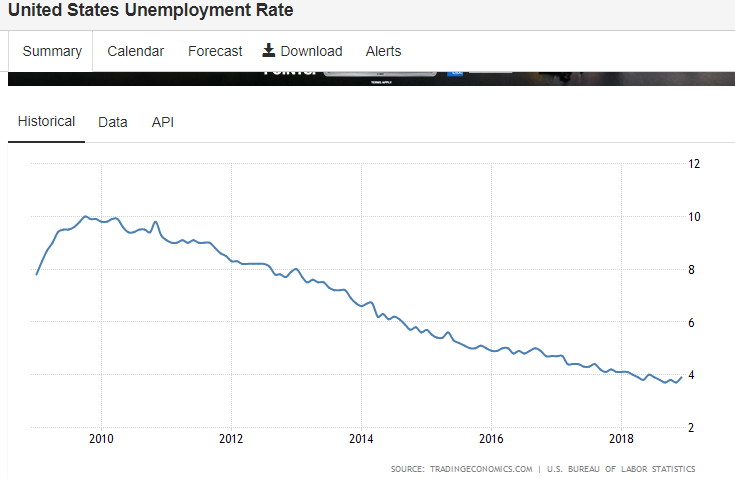
Unemployment
Unemployment is as low as we have seen in our lifetimes. There are more jobs than workers, and it is a good time for labor and employees in nearly every sector of industry.
https://tradingeconomics.com/united-states/unemployment-rate
Trade Wars – What will China and the US do?

Maybe the single most pivotal event for investments in 2019 will be the outcome of the China/US trade talks. Both countries are threatening each other with tariffs on hundreds of billions of dollars of goods, and both countries may suffer devastating impacts on each of their economies if those tariffs are actually enacted. But will they do so? Economists of all persuasions uniformly believe that tariffs are harmful to trade, and that there are no winners and only losers when tariffs are widespread.
All of us, both as individuals and countries, try to maximize our own financial well-being and make decisions that are good for us. China desperately needs our consumers to keep buying their goods as we are their biggest trading partner – and we also desperately need China for their cheap goods and because we also owe them trillions of dollars. It is hard to believe that either country would not want to come to an agreement to keep their countries finances strong, and many wise observers think that we will eventually and inevitably have an agreement amenable to both the US and to China.
In the meantime, it is a nerve fraying parlay between two powerful negotiators, and the stock markets may continue to be turbulent until that agreement is (hopefully!) reached.
What about President Trump?
There is a strange anomaly about presidents and US stock returns – the third year of a presidential cycle has been far, far higher than other years. 2019 of course is the third year of Trump’s presidency.
US Stock Market Returns During each year of the Presidential Election Cycle
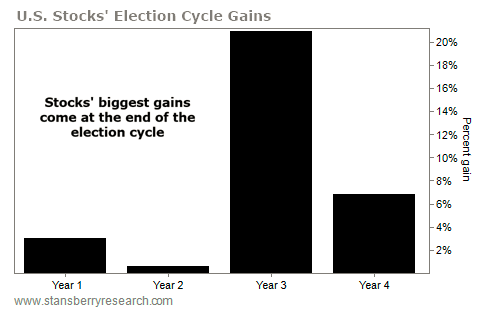
Here is the record of how the US stock market has behaved during other presidents. The history is quite surprising and encouraging to us as investors. The stock market does not like new presidents – the first and second year has tended towards subpar returns. This seems to be true of both Democrat and Republican presidents, as the returns early in their presidency are usually worse than those at the end of their term. Year 3 (which of course is 2019 for President Trump) has overwhelmingly had the highest historical return. We will have to wait and see if that powerful precedent is repeated for this year.
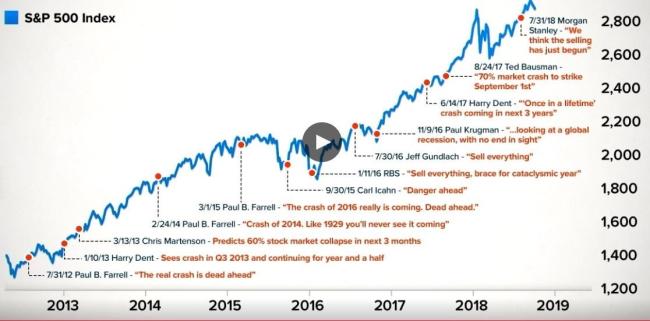
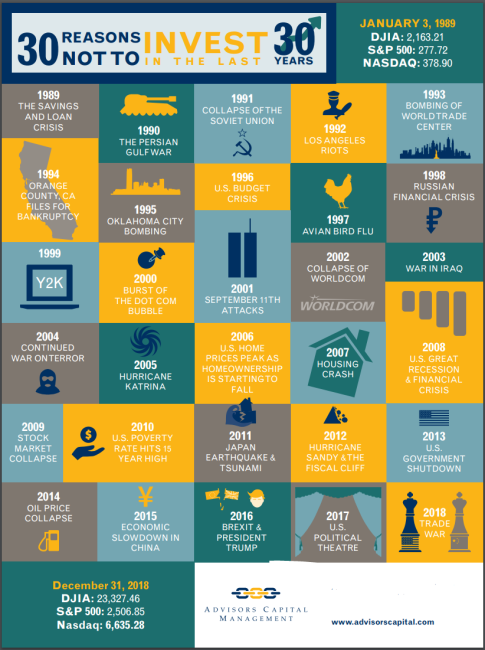
By the Way – what do the Experts Say?... and are they Ever Right?
If you read the media and internet, it is easy to be inundated by experts and pundits blaring predictions that are often compelling and logical. Remember some key principles about many of these predictions:
First – these expert “prophets” never seem to be held accountable when their predictions are inaccurate.
Second - the gloomier the prediction, the more readers the media seem to attract.
Third – they are frequently wrong! See the illustration below for just a few recent examples.
Bear Markets and recessions happen, and they will happen again. Rather than try and predict them, an investor may be better off making sure that their financial house is in order, and that they can endure through a downturn and persevere to try and best enjoy the fruits of long-term investment.
We have been walking our clients through a Robust Income Plan exercise recently for just that purpose. We will address that topic in more detail in a future newsletter.
Keep Your Eye on the Ball! – Fall client letter

To repeat our message from last fall – Keep Your Eye on the Ball! It is the long-term, patient investor who may enjoy the greatest benefits from investing!
https://www.geverswealth.com/blog/your-investmentsthe-markets-in-2018-what-to-watch
(thanks to ricedelalman.com for chart image)
My kids’ trampoline leap made me a little nervous – but they survived, and today they are strong and healthy. The markets’ drop in December and bounce in January might make all of us a little nervous – but we survived, and the economy and stock market today are strong and healthy.
I am looking forward to our next meeting, and as always, our team is available for any questions or concerns you might want to discuss before your next scheduled appointment.
Warm regards,
Willy Gevers
PS: if you are wondering, my kids are still a little wild, and now they jump from higher up! Several of my kids and my wife skydived from 14,000 feet this summer!

PS: We have been repeatedly asked by clients if they could share these e-mail notes with their friends or neighbors. Please feel free to forward this with the stipulation that it may only be forwarded if done so in its entirety with no portions omitted. We would be delighted to share our comments and opinions with your friends and welcome your comments and feedback.If you received this and would like to be included on our newsletter list, please email us at info@geverswealth.com
Copyright 2019 William R. Gevers. All rights reserved.
Gevers Wealth Management, LLC
5825 221st Place SE
Suite 102
Issaquah, WA 98027
Office: 425.902.4840
Fax: 425.902.4841
Email: wgevers@geverswealth.com
Website: www.geverswealth.com
The views are those of Gevers Wealth Management, LLC, and should not be construed as individual investment advice. All information is believed to be from reliable sources; however, no representation is made as to its completeness or accuracy. All economic and performance information is historical and not indicative of future results. Investors cannot invest directly in an index. Please consult your financial advisor for more information. This material is designed to provide accurate and authoritative information on the subjects covered. It is not, however, inteded to provide specific legal, tax, or other professional advice. For specific professional assistance, the services of an appropriate professional should be sought. Indices are unmanaged and cannot be invested into directly. Past performance is not indicative of futrue restuls. Securities and advisory services offered through Cetera Advisor Networks LLC Member FINRA/SIPC. Cetera is under separate ownership from an any other named entity.
US Money Supply, US Dollar, Inflation/Deflation, Debt Watch
"Neither a wise man nor a brave man lies down on the tracks of history to wait for the train of the future to run over him." - Dwight D. Eisenhower
US Money Supply – Adjusted Monetary Base
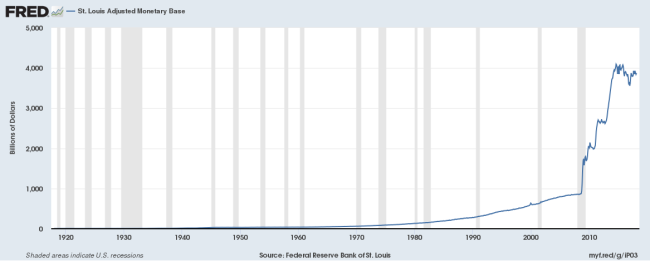
(http://research.stlouisfed.org/fred2/graph/?s%5B1%5D%5Bid%5D=AMBNS#)
US Dollar Price – (DXY) USD Index measured against other currencies
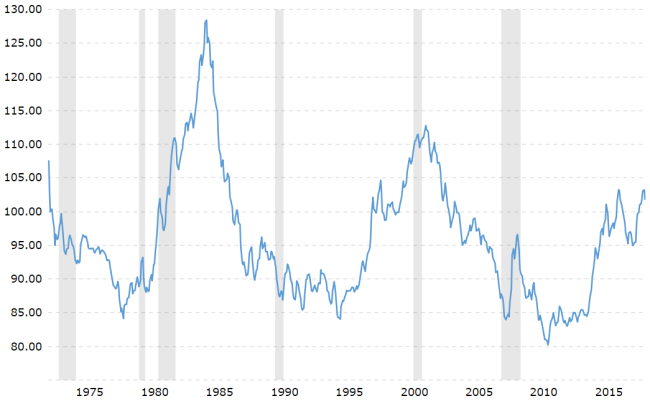
(http://www.barchart.com/chart.php?sym=DXY00&style=technical&template=&p=MC&d=X&sd=&ed=06%2F11%2F2015&size=M&log=0&t=LINE&v=0&g=1&evnt=1&late=1&o1=&o2=&o3=&sh=100&indicators=&addindicator=&submitted=1&fpage=&txtDate=06%2F11%2F2015#jump)
Inflation/Deflation:Year to Date price change in commodities as measured by futures
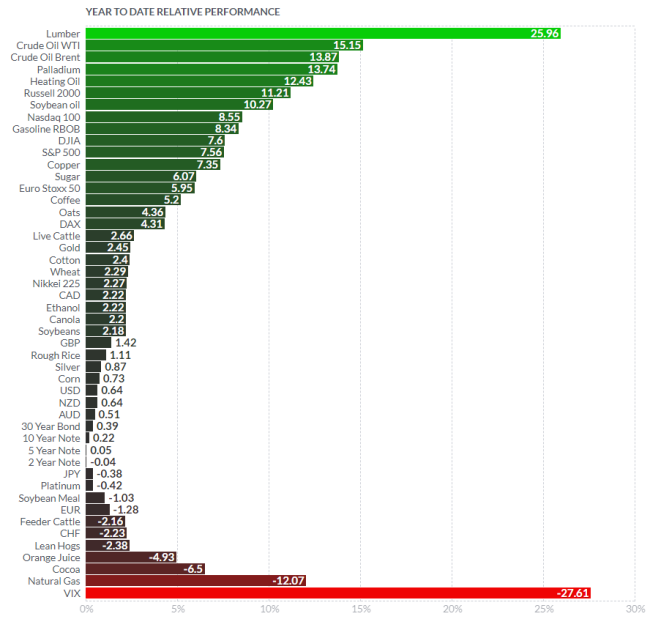
(http://www.finviz.com/futures_performance.ashx?v=17)
Velocity of Money – Velocity is a measure of how quickly money is spent. High velocity is typically a precondition for inflation.
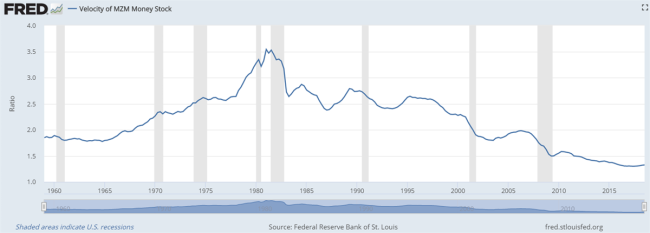
(http://research.stlouisfed.org/fred2/series/MZMV)
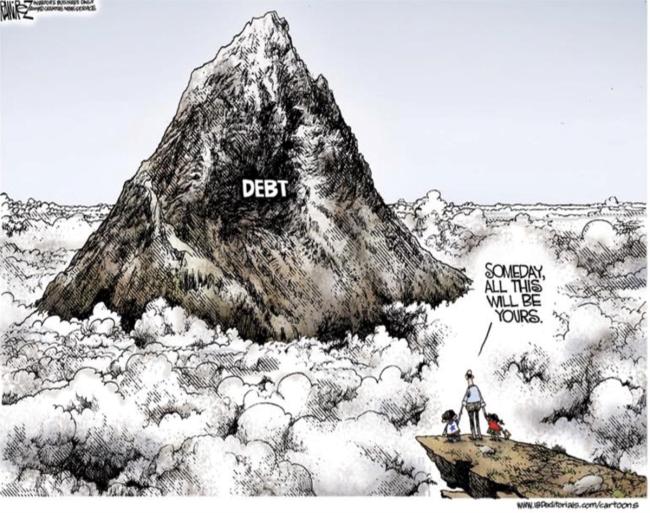
Debt
Tracking US Debt Levels - remember that increasing debt levels generally push up asset prices; stocks, real estate, and other investments. Eventually, debt levels will need to be reduced, or else we'll reach a point where extreme monetary fiscal policy must be taken if the debt reaches unsustainable levels. A family that lives beyond their means for too long and goes deeply into debt may end up in financial ruin. A country that goes too deeply into debt for too long may also have to have a day of reckoning.
“Let no debt remain outstanding, except the continuing debt to love one another, for whoever loves others has fulfilled the law.” - Paul
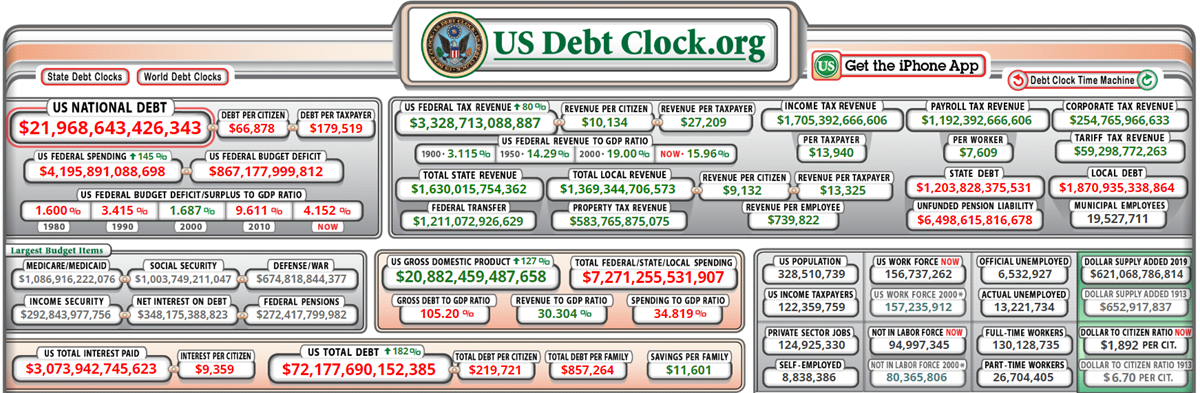
Total US Debt
US Debt to GDP Ratio
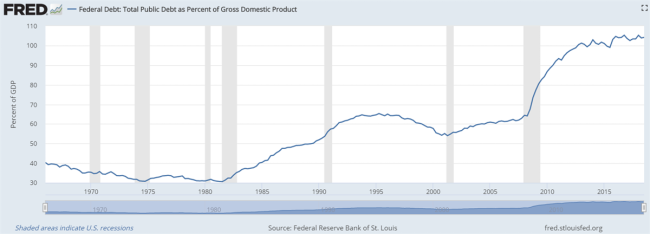
(note: ratio of US Federal Debt to Gross Domestic Product. Ratios >100% are unusual and considered economically unhealthy. https://fred.stlouisfed.org/series/GFDEGDQ188S )
Pension to Liabilities Chart – Public Pensions
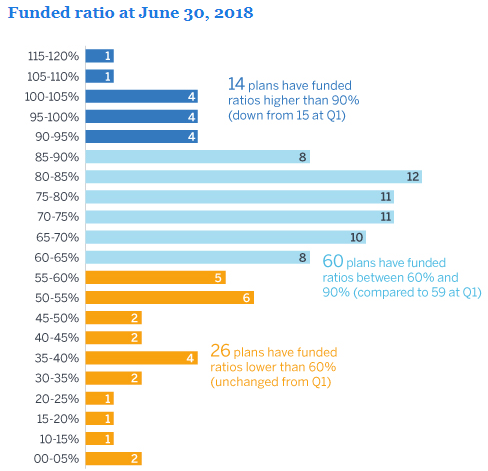
(note: 100% funding means that the pension plan has enough assets to pay its projected retirement benefits.)
Household Debt Payments as a Percentage of Personal Income
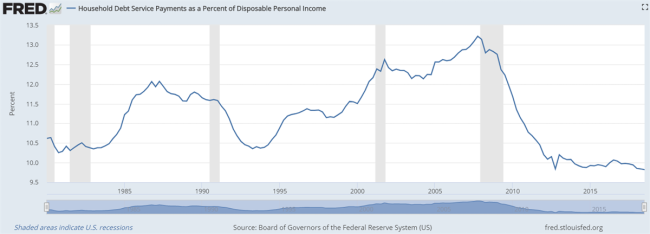
(Note: the lower the ratio – the better that households are able to make their loan payments.)
https://fred.stlouisfed.org/series/TDSP